Clarity
Help designers define meaningful, well-structured events without requiring specialist knowledge.
An AI-powered plugin that helps UX designers turn design context into consistent, editable analytics event plans—inside Figma.
UX Design Lead & Builder
Three months
Early-stage tool / initial usage feedback
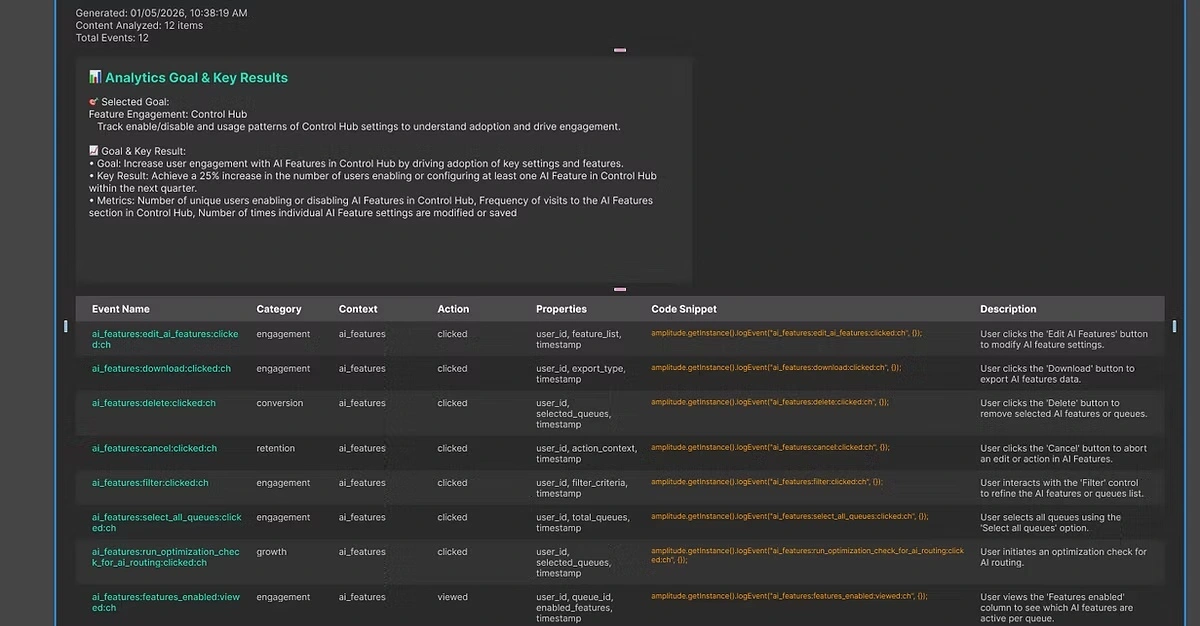
Analytics setup is a point of friction between design, product, and engineering. Designers are expected to make data-informed decisions, but defining the tracking plan often happens too late.
Across large product organizations, event names and structures can be inconsistent. Teams depend on specialist analytics partners, and designers may lack confidence in deciding what to measure.
Give designers guidance at the moment of design, so measurement becomes part of the workflow.
I designed and built an AI-powered Figma plugin to help designers generate analytics event plans from their design context without needing deep analytics expertise.
The plugin brings analytics planning into the tools designers already use. Shared standards guide the output, while designers retain the ability to review and edit the plan.
Help designers define meaningful, well-structured events without requiring specialist knowledge.
Use shared naming conventions and logical event structures across features and teams.
Make tracking plans part of the design process, rather than an additional task after design or implementation.
Support analytics experts with guided, standards-aligned output that designers can share with their partners.
My toolkit included Figma, ChatGPT, internal analytics standards, Markdown, and Cursor.
The plugin reads the screen to gather context for the experience being designed.
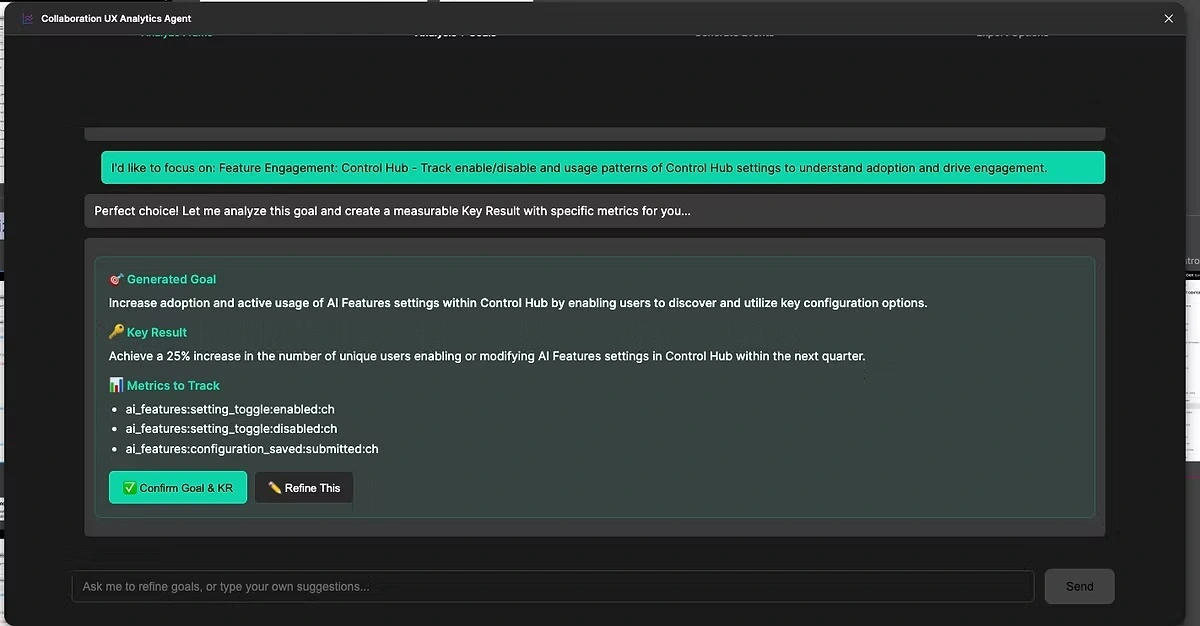
AI helps define the goals that events roll up to, with guidance for event names, required and optional properties, state transitions, and success and failure signals.
The plugin generates a structured tracking plan that is fully editable in Figma. Designers can review it, make changes, and share it with product and engineering.
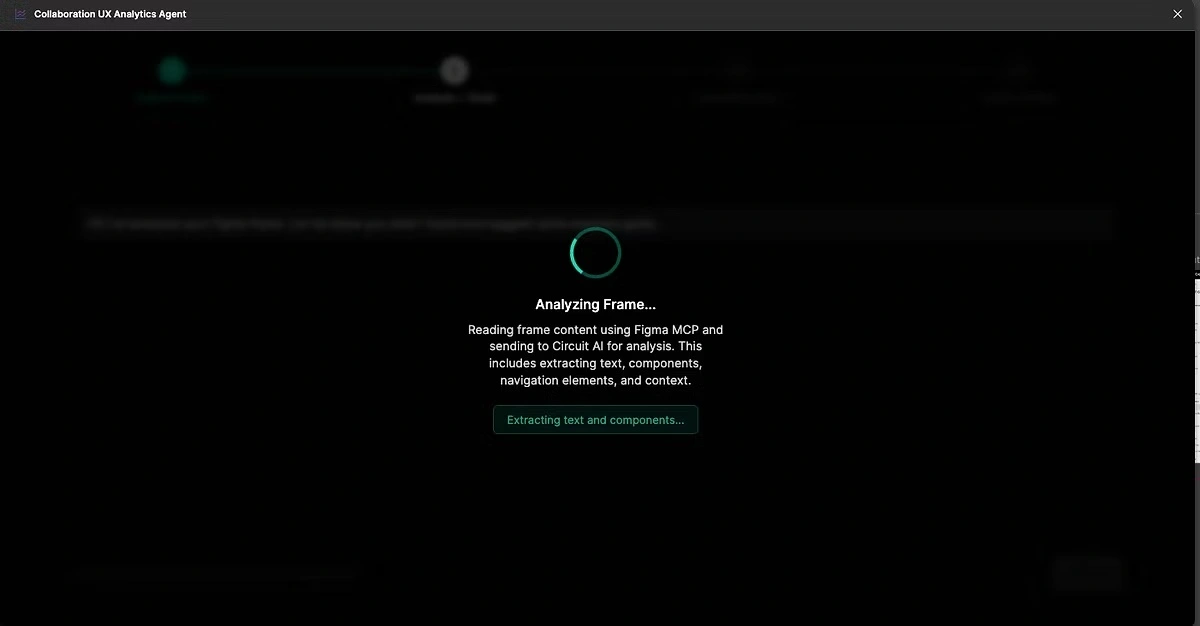
Initial usage feedback pointed to faster tracking-plan creation, more consistent events, and greater confidence discussing analytics.
One Webex designer described moving from a day of work to minutes. In my own use and a small group of other designers, the plugin saved an average of about two hours per analytics plan. Adoption was limited; this is an early result rather than a team-wide outcome.